How to Measure 2020 Advertising Performance Year Over Year

2020 was a year full of changes and upheaval, especially in the retail sector. Although e-commerce has fared somewhat better as an industry than its brick-and-mortar counterparts, there were still many changes in 2020 that greatly affected overall sales and revenue.

As 2021 gets underway, you’ll need to understand how your 2020 advertising performance impacted your business to accurately analyze your data. In this blog, we’ll help you evaluate your sales and revenue over the past year. We’ll also look at some reasons why your campaigns may have seen volatility. 

Want to learn how to adjust your reporting to account for unusual 2020 data? Read our blog: How to Account for the “2020 Effect” in Your 2021 Advertising.  

How to Track PPC Campaign Performance

To track overall performance, we normally recommend comparing year over year performance metrics. Every business sees some level of seasonality—even if sales are relatively steady—so a year over year analysis is a good way to ensure you’re comparing apples to apples.

If your business is highly seasonal, comparing performance year over year is even more important. For example, you wouldn’t want to compare 30 days after your season ends to peak season performance metrics. On the flipside, year-over-year metrics will give you a good idea as to whether your peak season was as successful this year compared to last year.

Here’s a good example of a year-over-year performance metric comparison.

Why Did My PPC Campaign Performance Change?

Several factors can explain shifts in year over year performance, even in the average year. These include pricing updates, changes to inventory, and changes in conversion rate. 

1) Pricing Updates

An increase in pricing might dampen overall performance year over year. If you’re above product pricing benchmarks, you could lose customers to less-expensive alternatives.

This might not be a huge concern, depending on the reason for the increase and whether your available margin increased as well. Sometimes, price increases are necessary and occur across the industry as a result of supplier pricing increases or higher taxes. 

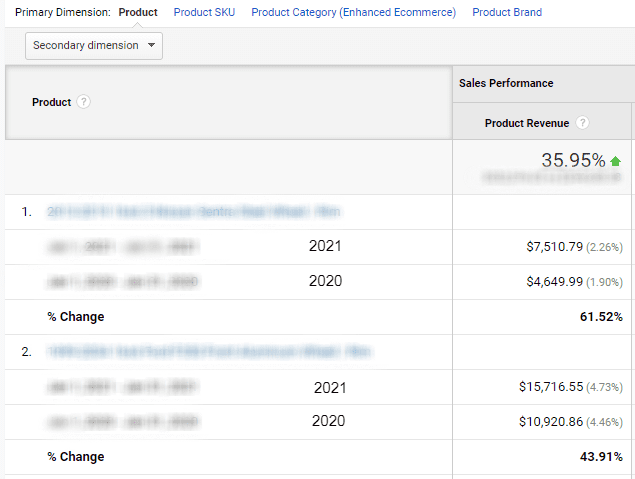
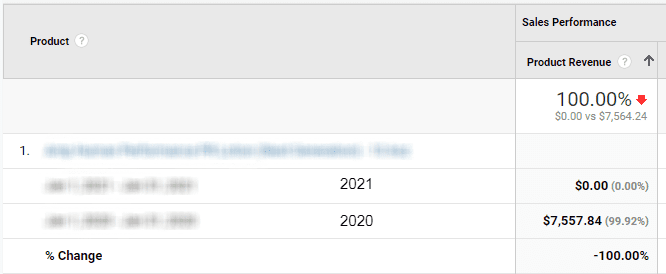
2) Changes to Inventory or Product Line 

Changes to inventory or product line often impact year over year metrics on the product or category level. Depending on which (or how much) inventory is affected, though, you may also see these changes impact your overall performance. Being out of stock on two of your most popular items will affect your sales and revenue in the aggregate more than being out of stock on items that are near the middle of the pack, revenue-wise. Consider this:

These top items are going to have a much larger impact on your overall revenue if they’re unavailable for sale.


3) Major Changes to Your Site or Conversion Rate

Finally, major improvements to your site, checkout process, or conversion rate generally will majorly affect your year over year performance metrics. If you’re converting far more traffic than before, you’re likely to see much higher revenue and sales figures overall. Conversely, if you’ve seen a major drop in conversion rate you are also likely to see a major drop in your sales and revenue (unless you’re driving a lot more traffic to compensate for the shift!) We’ll talk more about the importance of conversion rate later in this blog.

Check out these examples:

Struggling to drive more sales? See which factors affect your conversion rate here.

What Impacted My 2020 Advertising Performance?

These factors can affect your year over year performance analysis in a normal year—but 2020 was a year that brought exceptional volatility to, well, pretty much everyone. Some occurrences that caused shifts in performance for e-commerce specifically in 2020: 

  • Upheaval in the Supply Chain
  • Dramatic Shift to E-commerce
  • Changes in Consumer Purchase Habits
  • Economic Uncertainty

Let’s look at each of these in detail. 

Issue #1: Upheaval in the Supply Chain

In Q1 of last year, an outbreak of COVID-19 majorly affected the flow of consumer goods from countries like China and South Korea. These countries (and others around the world) make up a significant portion of goods imported to the US in any given year. When manufacturing slowed, it caused a major disruption in the supply chain in the US. Retailers (and manufacturers) found various ways to deal with supply chain shortages, but many also suffered from a dip in sales due to out-of-stock or unavailable products.

If you pivoted to promoting a new product line or cut off spending on a product that was unavailable, your previous year’s data might look quite different from this year. If supply chain issues have been resolved, performance this year could far outweigh last year for some products.

These changes could be evident across your business if you pivoted to a new product line. Keep in mind any changes last year to your overall available margin could have impacted your metrics, and account for that when you look at this year’s performance.

Issue #2: Dramatic Shift to E-commerce

COVID also caused a rapid shift in consumer behavior away from brick and mortar shopping to online purchases. This shift was a double-edged sword. Many e-commerce retailers found themselves facing demand like never before (even to the point of being unable to fulfill additional orders). Others whose businesses primarily served industries hard-hit by the pandemic (like restaurant supply stores) faced a significant decline in sales and revenue.

Graphic above from DigitalCommerce360.

Even if you’re one of the retailers who saw record growth – it’s important to remember that you may not experience that kind of increase again this year.

Issue #3: Changes in Consumer Purchase Habits

Not only did consumer behavior shift to ecommerce, but purchase behavior shifted too. Crafting and hobby retailers (especially those selling sewing supplies) saw gains last year, as did the aforementioned home goods and outdoor sectors. Retailers who offered curbside pickup or delivery also gained an advantage. Some of these trends are likely here to stay, while others— like the increased interest in sewing—stand a good chance of changing again once life returns to normal.

You might be one of the retailers who saw a massive increase in demand this year, or you might have seen sales drop. Performance might even have shifted widely across certain product segments. If you sell apparel, for instance, your business clothing section may have seen declines while segments like athletic gear sold far better than before.

Issue #4: Economic Uncertainty

Of all the issues we’re calling out in this blog—this is the one that is going to be the hardest to pinpoint in 2021. The events of 2020 caused a great deal of economic uncertainty that manifested most recently in a very weird holiday season, in which consumer spending as a whole shot to record highs but many consumers sought extra bargains and sales. What remains to be seen is how much of that behavior will persist into 2021—and whether any potential shortfalls will hit ecommerce or remain primarily among brick and mortar retailers.

Use Your 2020 Advertising Performance to Improve Your 2021 Advertising

From ongoing economic turmoil to supply chain issues to changes in consumer behavior caused by the pandemic, 2020 brought a lot of upheaval to retailers. Ecommerce fared better in many ways than brick-and-mortar, but many online stores still felt the impact.

Now that you have an idea of which factors may have impacted your 2020 advertising performance, head on over to our blog “Account for the ‘2020 Effect’ in Your 2021 Advertising Management.” In this blog, we’ll look at how to apply your findings from 2020 to your 2021 management.

Need help understanding your 2020 advertising performance? Reach out to speak to an analyst today. 

Did you find this article helpful?

Get more delivered to your inbox just like it!

Search