Do you struggle to keep up with competitor pricing? I had a customer who recently launched a new brand with over thousands of items—but the entire brand was performing poorly. With this being a new brand, I had no historical data points to rely on, so I decided to turn to the price competitiveness report in Google Merchant Center.
If you’re facing a similar battle with your product pricing, let me share with you how I used the price competitiveness report to identify products that needed to be adjusted.
How to Get to the Price Competitiveness Report
Log into your Google Merchant Center account
Go to the “Growth” tab to your left
Below that, click “Price Competitiveness”
If you don’t see this report, you will need to enable Market Insights from your administrator account:
First, go to Google Merchant Center→ Growth→ Manage Programs
Next, make sure Market Insights is enabled under Manage Programs (if it is not enabled, you should see a “get started” option)
Click “get started” to enable Market Insights
After you do, you will have access to the Price Competitiveness Report and the Best Sellers report
What Are Benchmarks?
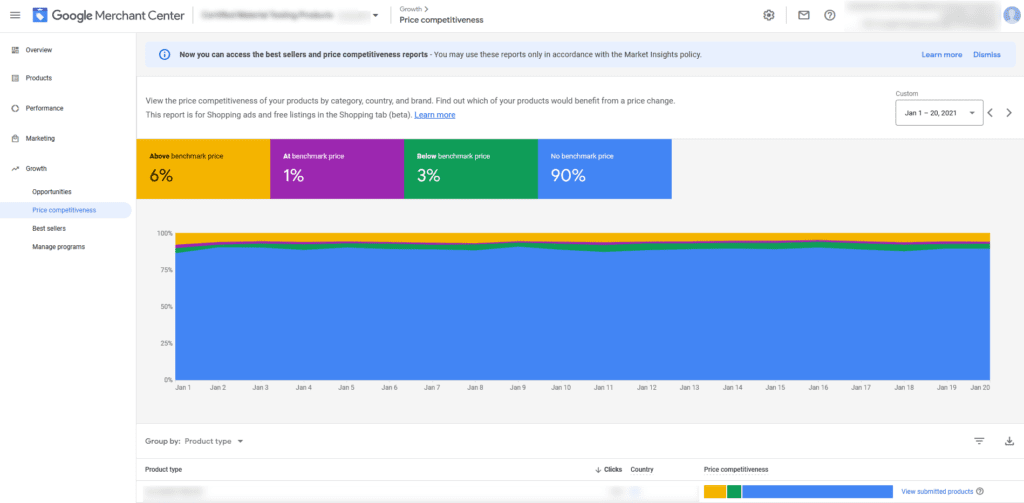
If you aren’t familiar, the benchmark is the average price for products you sell across all sellers. Here, you can see how your products compare to benchmark pricing.
Like the graph below, you can see what percentage of items fall below the benchmark (i.e. beating competition), above the benchmark (i.e. being out-priced), and at the benchmark (i.e. on par). If the majority of your products fall above the benchmark price, that’s likely not a good sign and should be investigated immediately.
Choosing Product Groupings in the Price Competitiveness Report
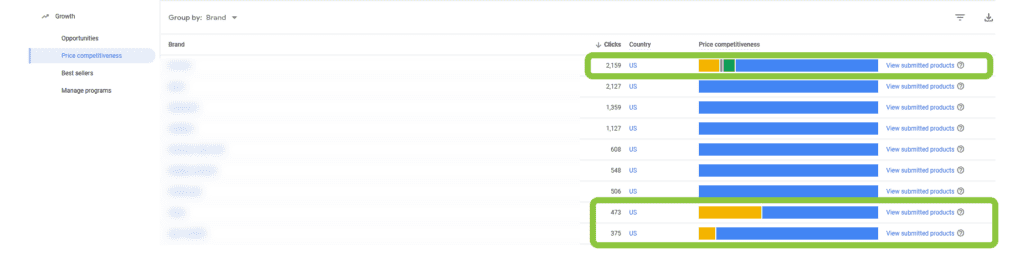
Below the graph, you can group products in four different ways: Product, category, brand, or product type. Use the grouping that best suits your needs. For example, I grouped products by brand so I could look into the particular brand that was struggling for my customer. As a rule of thumb: If a particular category isn’t performing well for your campaigns, group your products by campaign.
When you group your products, you will see a table like what’s pictured below. Since I’ve grouped by brand, this image shows price competitiveness for particular brands. The small graphs to the right will indicate which brands need to be investigated. The more yellow you see in the bar, the more over-priced items that grouping contains.
How to Investigate Items with Benchmark Differences
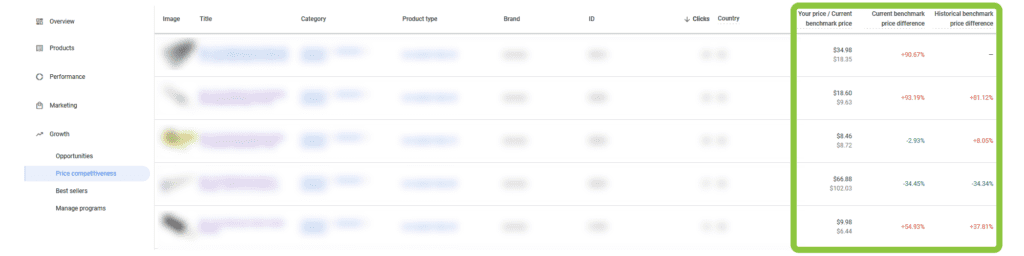
1. Choose a product to start with.
When you click into the brand, you’ll see price competitiveness for individual products within that brand. Google makes it pretty easy to single-out items that are out-priced. Simply look under “current benchmark price difference” and find the items highlighted in red that are over the benchmark.
2. Search for your product on Google Shopping.
Now, we need to get more of the necessary details that the Google Merchant Center price competitiveness report does not provide. To do so, we will search each out-priced item on Google Shopping:
Search the product title on Google Shopping
Find your product
Click on “compare prices” to see other prices from your competition
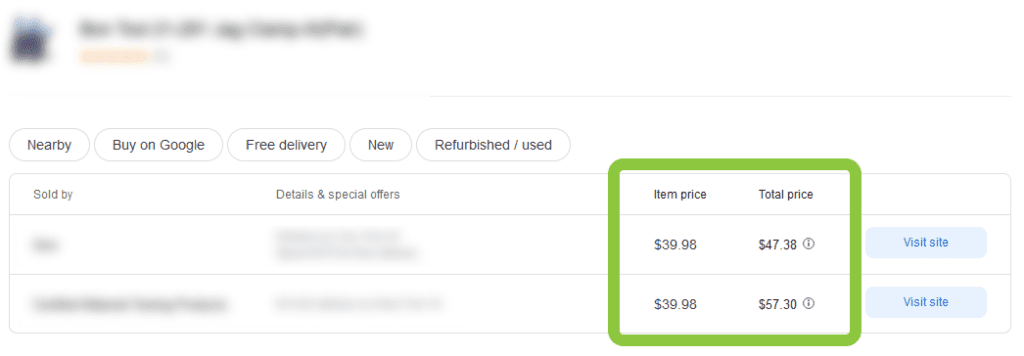
3. Compare pricing & look at total prices.
Look at the “Total Price” instead of the “Item Price.” I do this because it includes shipping and sales tax, which provide a more accurate final price. I think it’s important to note that Google’s benchmark comparisons in Google Merchant Center only take “Item Price” into account, so don’t take their results at face value.
The product above is a great example of this discrepancy. In the price competitiveness report, this product appears to be price competitive; but when I look it up myself, I can see that my shipping is about $10 more than the competitor, so we’re actually being out-priced here. I wouldn’t have caught this had I not done more digging on my end.
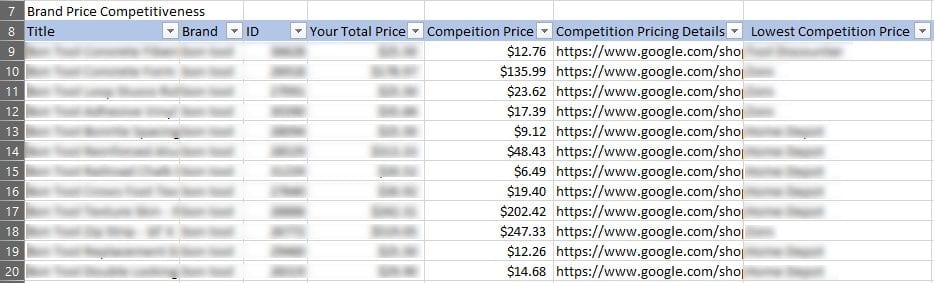
4. Compile the data in a spreadsheet.
Finally, I put this data into a spreadsheet for easy reference. I list the total price here, since this price does not show up in the Google Merchant Center report. This spreadsheet is a useful reference for deciding which steps to take next.
Price Competitiveness Report: A Great Starting Point
Google’s price competitiveness report has its shortcomings, such as not providing competitor details and not factoring in total price. Additionally, the majority of your items will often not have a defined benchmark by Google. Even with these downsides, I’d say (overall) it’s a fairly useful tool to see how your pricing stacks up against the competition, especially for specific brands.
It provided me with a clear explanation as to why my customer’s new brand was performing so poorly, as almost every item I looked up was being out-priced. So as long as you don’t take Google’s price competitiveness report at face value, and do a little extra research on your end, it’s a great jumping-off point for improving your pricing.