Each of the below Google Ads metrics is key for understanding what’s going on with your ads and which steps you should take to grow revenue and profit. However – tracking metrics isn’t nearly as important as being able to correctly interpret them. Increases or decreases in a metric’s value can have vastly different meanings depending upon other metric values or other factors in the account. The only way to know is to look at the whole picture – so let’s dive in!
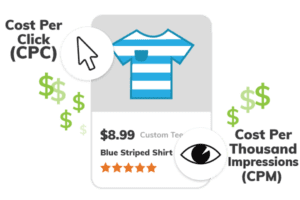
Ad Spend is (obviously) the amount spent in a given timeframe on your ads. In most cases, this is measured in terms of cost-per-click, although display ads may be measured by cost per 1,000 impressions (CPM).
Many advertisers equate ad spend to budget, which isn’t necessarily true. In fact, there’s an argument to be made for setting budgets to be essentially unlimited. If a campaign is profitable, there’s no reason to limit spend, because the return will be greater than the investment.
For this reason, shared budgets are also a good choice, allowing the campaigns that are the most productive to tap a greater percentage of the overall pool.
In most cases, ad spend is measured in terms of cost-per-click, although display ads may be measured by cost per 1,000 impressions (CPM).
Average Order Value
Average order value is just that – the average amount of revenue attributable to each order. When looking at this metric, it’s crucial to consider context. How many orders have been placed this month? Have you had any outliers – especially large orders that might skew the overall average? Were you perhaps running promotions on low-dollar items, or offering a major coupon that could reduce the amount of revenue per sale? All of these factors can impact your view of this metric.
AOV also offers important context for overall performance. For example, in many cases, a dip in traffic and in overall sales indicates an issue in the account. However, there are instances in which those metrics fall, but an overall improvement in conversion rate and average order value creates more revenue (and profit!)
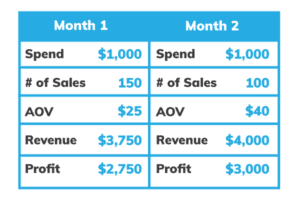
Consider this scenario. You have $1,000 to spend on PPC ads. One month, those ads drive 150 sales, at an average order value of $25, for a total revenue of $3,750 and $2,750 in profit. The next month, that same spend only drives 100 sales – but average order value is up to $40. In this case, your cost per order has risen to $10, but your revenue is now $4,000 and your profit is $3,000.
Increases in AOV can often create more revenue and drive profit - as seen in this example.
Clicks
Clicks are pretty self-explanatory. This metric refers to the number of times a user has clicked on your ad. This can be anywhere on the ad, including sitelink or promotion extensions for text ads.
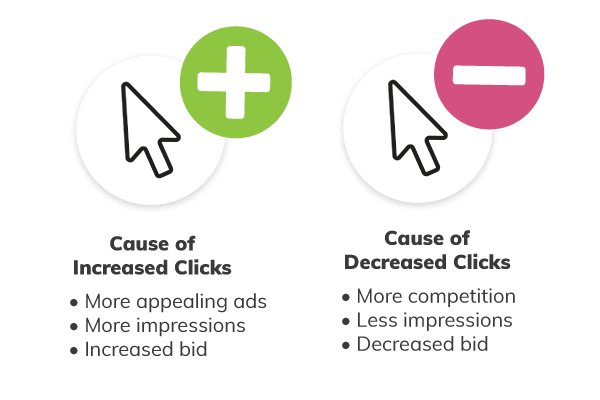
We look at clicks as a measure of traffic to the site. A rise in clicks can mean ads are more appealing to the audience, or that the ads are receiving more impressions. Often, an increase in bid is accompanied by a bump in traffic, and we often advise giving ad groups a bit of a boost if traffic isn’t strong or is declining.
Declining clicks can also be an indicator of the market. An influx of new advertisers on terms your business has historically capitalized on can have a very detrimental impact on traffic, especially if those advertisers can afford to bid much more on those terms. We’ll cover more on how to get the most from your spend below!
Click-Through Rate
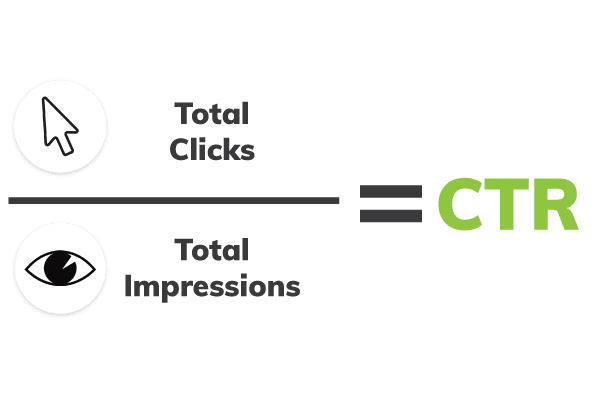
Click-through rate is the percentage of times a searcher who has seen your ad subsequently clicks on an ad. CTR is a good measure for how effective the overall appearance of an ad is. Do searchers want to click on it? Or do they simply pass you by?
Of course, a slightly lower CTR might simply mean you’ve had a spike in impressions (if your ad is suddenly at the top of the page, for instance!) If your CTR is extremely low or falling, however, you may want to take a investigate ad placement or evaluate pricing to ensure you’re competitive.
Above is the equation for calculating click through rate. Simply divide total clicks by total impressions.
Contribution
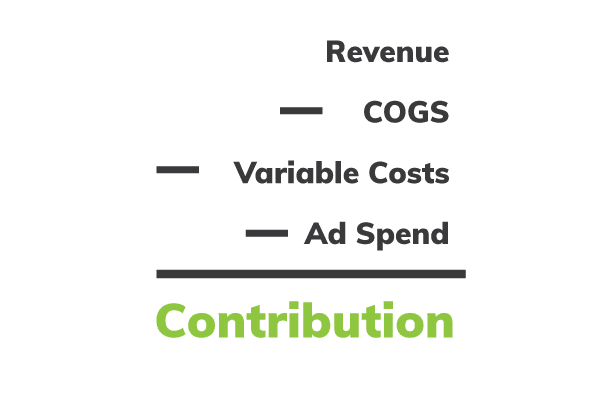
For many of our clients, contribution is the focal point of their advertising approach. Contribution is the amount that paid ads (or other channels) contribute to overall operating profit. From an accounting perspective, contribution refers to the dollars leftover after the cost of goods, other variable costs, and ad spend have all been accounted for.
At Omnitail, we manage accounts to maximize contribution. This could mean increasing revenue, or cutting ad spend – or some combination of the two. We often assess contribution on a product segment level, and use that analysis to redirect spend from unprofitable segments to profitable ones. Overall contribution then increases, because spend is limited in areas that don’t provide as much profit, and much more expansive in areas that have room to grow.
Above is the equation for calculating contribution. Simply subtract cost of goods sold, variable costs, and ad spend from your revenue to find your contribution.
Contribution Margin
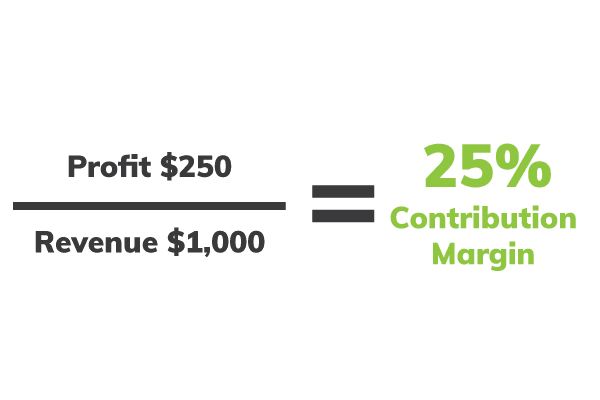
Contribution margin is a measure of contribution (or profit) as a percentage of revenue. It’s also sometimes known as contribution rate. If your revenue from Google Shopping sales was $1,000 with $250 remaining as profit, you would have a contribution margin of 25%. Remember – contribution factors in ad spend and other costs, so contribution margin is a measure of the percentage of revenue left over after costs have been accounted for.
Contribution margin targets can change depending upon the ads, the goal of the campaign, and the advertisers’ other costs. Some advertisers may aim for targets as high as 25 or 30%, while others might have high costs that limit margin to 10-15%. Some may have lower margin goals because they prefer to use the majority of their revenue to fund additional ad investment, or because they feel lifetime customer value justifies running an ad program close to break-even.
A conversion generally refers to a customer taking a desired action on your site. For most e-commerce sellers, the primary conversion is transactions or sales. Some advertisers track leads (especially B2B businesses) and some rely heavily on offline conversions like phone orders or sales in a brick-and-mortar location. Conversions can even be alternate onsite actions like product reviews or email signups. Below we explore the different types of conversions.
1. Online Sales
We recommend Google Analytics to track online sales. In addition to products sold and order value, Google Analytics can help retailers figure out where they’re losing potential sales.
We use Google Analytics to track conversions according to multiple attribution models. Comparing results across models offers a holistic view of campaign performance.
2. In-Store Sales
With the rise of local inventory ads, online retailers who maintain a brick-and-mortar presence may see an increase in in-store sales. These sales can be tracked in Google Analytics, either by direct upload or by partnering with a third-party CRM.
Retailers can also test an assumption of sales lift attributable to ads, and use that to drive PPC strategy.
3. Phone Sales
Some retailers – such as those that offer customization or sell big-ticket items – make the majority of their sales over the phone. Doctors’ offices and realtors often track appointments set over the phone as conversions as well. Although these conversions can’t be tracked in the same way as traditional sales, third-party call tracking software can still help accurately attribute phone calls to PPC campaigns.
4. Leads
B2B (and some B2C) businesses track leads as conversions instead of sales. In the last section, we covered leads obtained over the phone – but online form fill-outs and button clicks can be tracked as conversions as well. It’s even possible to track lead actions such as views of a video or other interactions with a page as conversions, but don’t go overboard – too many actions with varying value to your business can make it incredibly difficult to draw actionable insights.
5. Product Reviews
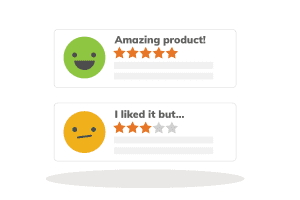
Product reviews have very real value for businesses. In addition to providing positive social proof for future customers, reviews can help identify product evangelists and likely repeat customers. Even negative reviews can be helpful for pinpointing problems with products, vendors, or shipping methods.
Reviews can be tracked as conversions in the same way as leads – by tracking form submissions or button clicks.
Conversion Rate
Conversion rate is the rate at which users who click on your ads convert on your site. In other words – what is the rate at which your ads are driving sales?
Your conversion rate can be affected by a number of factors. Are you allocating spend toward products or ads that are most likely to attract customers? Is your website optimized for conversion rate? Price increases or stock status can also have a detrimental impact. If your prices are much higher than your competitors’, or if your most popular item is out of stock, you could see dramatic reduction in conversion rate. On the other hand, our clients often report high conversion rates when running a sale or when featuring a highly in-demand, exclusive item.
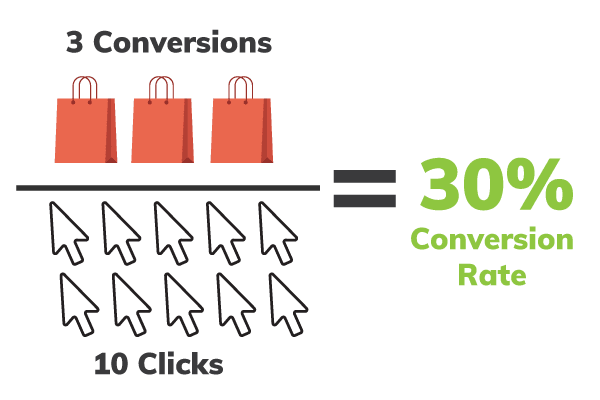
Above is the equation for calculating conversion rate. If you have 3 conversions and 10 clicks, you have a 30% conversion rate - meaning 30% of your clicks resulted in a conversion.
How Conversion Rate Affects Sales
Conversion rate has a major impact on profitability. Using the Google Ads model, you pay for every advertising-related click through to your site. If your site isn’t optimized for conversions, or your products and services aren’t attractive to the consumer, you’re racking up a lot of spend for clicks that ultimately may go nowhere.
Don’t ignore mobile conversions, either. An ever-increasing percentage of shopping and sales is taking place on mobile devices—and it’s important to have a website that is just as functional on mobile as on desktop. Google has a handy tool to help measure your site’s conversion potential— check it out to see how much revenue you can gain by optimizing.
Conversely, you can stretch your ad spend further by ensuring you maximize the potential for conversion. Make every click count, and you’ll see conversion rates (and profits!) grow.
You pay for clicks to your site - so if your site isn't optimized for conversions, you will end up wasting a lot of ad spend. This is why optimizing your site is so important!
What’s a ‘Good’ Conversion Rate?
We are often asked, “what’s a good conversion rate?” There’s no one answer. Every industry has different benchmarks for success, and factors like competition are important as well.
The most important thing is to continue (overall) to improve your conversion rate, wherever you’re starting. Take a look at the Checkout Behavior Analysis report in Google Analytics, and see where customers are leaving the purchase process. Perform regular pricing analyses to ensure you’re staying price-competitive in the market. Enlist the help of a tool like Hotjar to explore user behavior on your site, and make changes to improve engagement – and by extension, conversions.
Cost of Goods and Variable Overhead
Cost of goods is just that – the cost required to purchase inventory to sell. These costs vary widely among advertisers – some spend as little as 10-20% of revenue from the sale of a product on inventory, while others have costs in the 75-80% range. Most advertisers have costs that vary across their product catalog. Google now allows these costs to be passed through the feed – making it much easier to factor these costs into your ad management.
In addition to cost-of-goods, there are a number of other costs that have a real impact on business – and should definitely be accounted for in your advertising strategy.
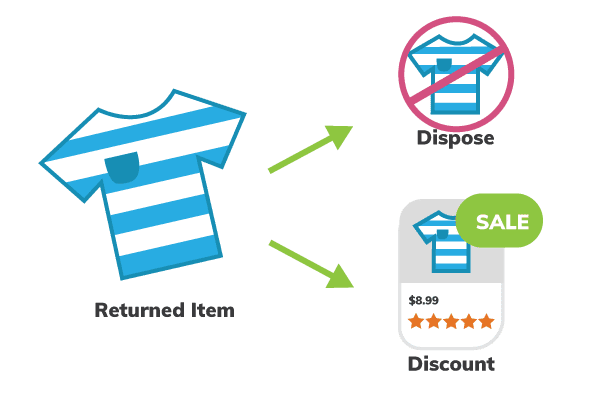
While returned goods can sometimes be sold at full price, often these products have to be disposed of or sold off to clearance resellers. If some products have a much higher return rate than others, you need to factor that into your optimizations for profit.
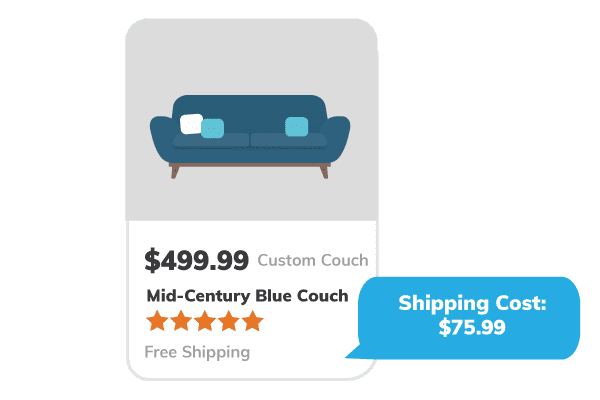
Shipping
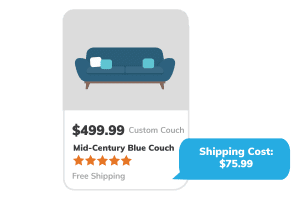
Shipping is another crucial cost to track. Because shipping costs can vary so much depending on the weight and type of product, not including these can cause you to push spend on some products to an unprofitable level.
Cost of Goods
This is arguably one of the largest costs for the average retailer. As such, it’s one of the most important metrics to track to maximize cost. We track cost of goods on the SKU level for most of our clients to measure cost and its impact on account performance.
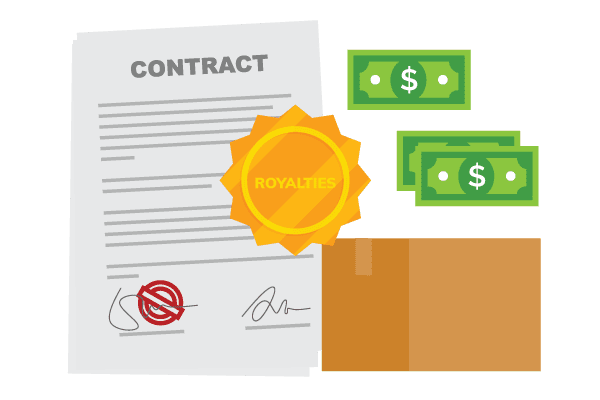
Variable Overhead
Depending on the retailer, this could include packaging, licensing, or royalty costs. Like cost of goods, it’s important to track overhead on a precise level. You may want to drive less ad spend toward products with an exceptionally high cost of goods.
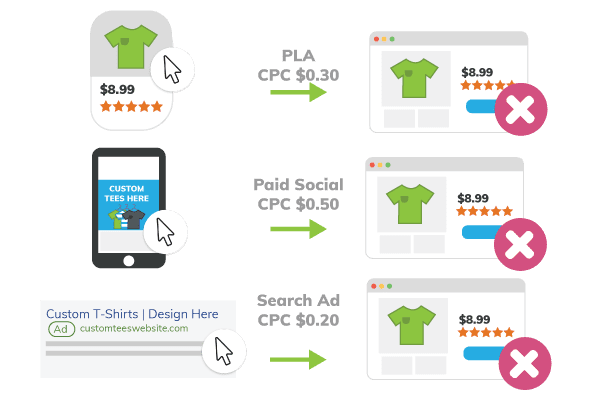
Cost Per Click
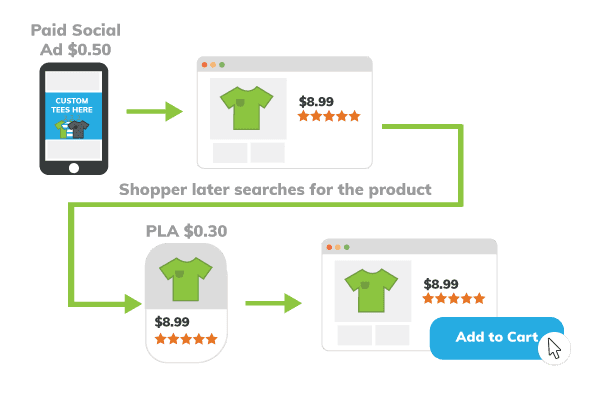
Cost per click is just that — the cost spent to acquire a click on an ad. This metric can be very easily misinterpreted and should be carefully considered. So how much should you spend to acquire a click? Honestly, you’ll probably never encounter the same answer twice, for a couple of reasons.
Not All Clicks Are The Same
If a searcher clicks an ad on a search term that is highly likely to convert, it’s worth it to spend more to acquire that click because it’s likely you’ll also acquire a customer. We’ve built an entire process around finding and targeting that highly-specific, very valuable traffic. We won’t cover it in detail here, but read all about query segmentation to learn more!
Seasonality Matters
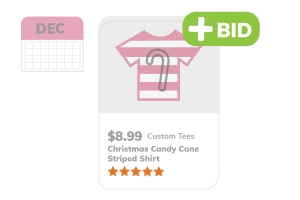
If the holiday shopping season is a pivotal time for your business, increasing spend to acquire more traffic is a given. If that’s the case, it’s also likely your competitors will be increasing budgets as well, meaning you’ll need to spend more to acquire even the same amount of traffic, let alone drive additional sales.
Direct with Ad Spend Wisely
Bidding the same for every product is a huge (but common) mistake. Some products provide additional profit for your business, while others have hidden costs like shipping or a high return rate. Every product requires some ad spend, but products that drive profit efficiently merit more effort to acquire sales. See how to bid effectively on Google Ads!
Cost per Order
Cost per Order refers to the ad spend required to acquire each order. This metric shouldn’t be used to direct the strategy of an account on its own. Rather, it should be viewed in light of the revenue and profit an average order brings in. If average order value (see below!) rises, it’s worth it to spend more to acquire those orders. In that case, an increase in cost per order isn’t a bad thing. Conversely, you may need to cut cost per order if average order value falls for some reason, or if cost of goods rises significantly.
Learn how CPO is linked to average order value and profit in our guide.
Impressions
Impressions refer to the number of times your ad is shown. Impressions can happen on a search results page, within the Google Shopping platform, on an app, or on another website.
Impression share is a closely related metric that measures the percentage of impressions an ad receives compared to the total available impressions. For most ads, this is pretty straightforward. Because multiple Shopping ads from the same advertiser can show on the same term, Google awards share in those cases to the highest-ranked ad.
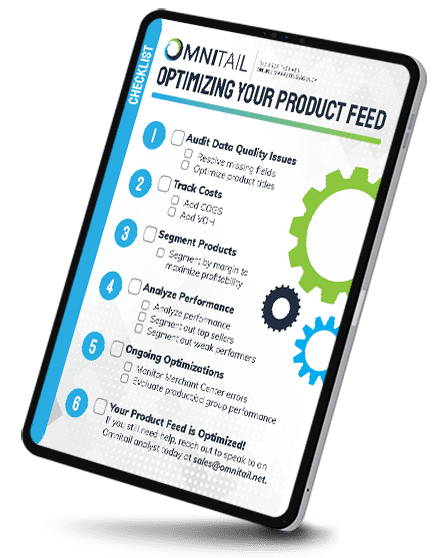
Optimizing for Profit
As we’ve covered above, it’s crucial to measure not only efficiency, but also cost in directing your ad spend. With new attributes in the product feed like cost of goods, it’s becoming much easier to segment and manage your Google Shopping campaigns according to profit. Doing so offers you the best view of the impact spend on certain segments has on your bottom line, and enables you to redirect spend when necessary to products that are most profitable.
Why Use Profit Instead of ROAS?
Although many companies use ROAS as the ultimate arbiter of success in their advertising account, this is a very misplaced assumption. ROAS is just a measure of efficiency – the return on your ad spend. A 10k ROAS target can be achieved with $1,000 in revenue, or with $100,000, depending upon your spend. Obviously, $100k will likely have more of an impact on bottom line!
ROAS also does not account for costs. Therefore, operating profit in terms of whole dollars can often be increased at a different or even lower ROAS target, especially if spend can be redirected from less-profitable products.
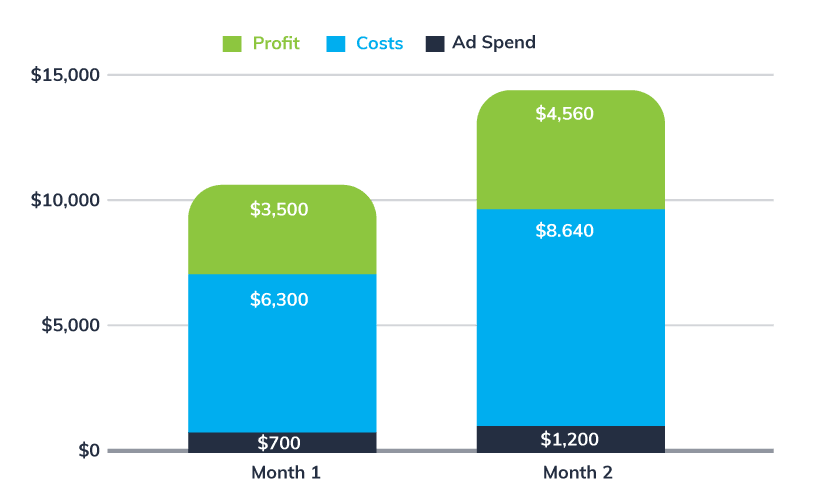
Consider the following scenario.
Month 1
Let’s assume you spend $700 on advertising and see a 15x ROAS, resulting in $10,500 in revenue. That looks really good on paper—but you aren’t accounting for your costs, like cost of goods or variable overhead. If costs comprise roughly 60% of revenue, then profit is just $2,500 by the time those costs and your ad spend are accounted for.
Month 2
The next month, you spend $1,200 on advertising, and drive $14,400 in revenue (a 12x ROAS). At the same cost, you take home nearly $4,560 profit after accounting for cost of goods and ad spend. If you insist upon a 15x ROAS, you will never discover that higher ad spend and lower ROAS creates incremental profit gains.
Revenue
Revenue is the amount of money obtained from conversions or sales. For most businesses, this is one of the most important metrics. Revenue can be profoundly affected by the other metrics in you account. Cutting back on overall spend and reducing your cost per click can reduce the number of impressions and clicks you receive. Without an increase in conversion rate, that will lead to fewer sales and less revenue.
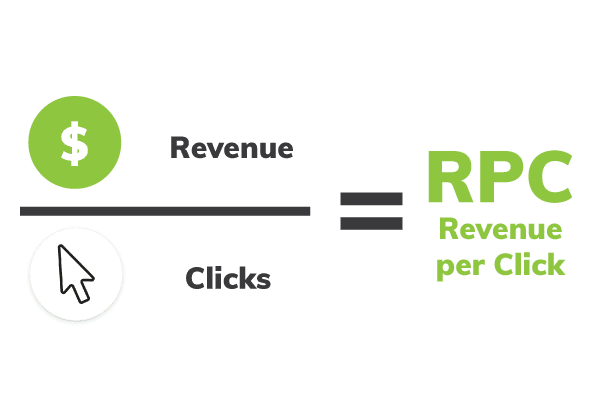
Revenue per Click
Revenue per click is one of the most important metrics for optimizing an account for profit. If you can increase the amount of revenue generated per click, an increase in cost per click may also be justified. If you can increase RPC while controlling cost (by redirecting spend toward highly profitable items or search terms, for instance), profit will increase as well.
Conversion rate is also closely linked to revenue per click. If you can improve your conversion rate, you require fewer clicks to bring the same amount of revenue – increasing your revenue per click. A decline in revenue per click, then, could be attributable to a lowered conversion rate. An increase could be linked to an improved conversion rate, more effective advertising, or even simply an increase in sales across higher-priced products.